


")


Most of the time, the creative part is like playing in the sandbox. I can sit here and work for 12 hours and not get tired of it.
A sandbox is an isolated test environment that allows users to run programs or execute files without endangering the application, system, or platform they’re running on. Software professionals use the sandbox to evaluate suspected code without putting the device or network in danger. Sandboxes are an automated malware analysis solution and a widely used way of threat and breach detection that cybersecurity professionals use to test malicious files, software, and URLs.
Detecting malware in a sandbox adds another layer of defense against security risks like stealthy attacks and exploits that take advantage of zero-day vulnerabilities. Endpoint and detection response (EDR) platforms are home to some of the most recognized sandboxes available today.
Why we need sandbox?
- Sandboxing can help you detect the most recent and dangerous threats, boost collaboration, and reduce risk. As it really operates in a separate system, sandboxing protects an organization’s vital infrastructure from malicious code.
- It allows SOC analysts to test malicious code in a controlled environment to better understand how it operates within a system and to detect similar malware attacks more quickly.
- Monitoring suspicious behavior to detect malware has become more difficult as malware has become more complex. Many malware have used advanced encryption methods in recent years to avoid detection by endpoint and network protection products.
- The most sophisticated monitoring and antivirus software can’t always predict what a dangerous code will do when it’s executed. Antivirus software is known for its capacity to scan programs as they are transported, downloaded, and stored. We bridge the security gap left by conventional solutions by processing applications in a sandbox environment.
Free sandbox solutions:
There is a number of free sandbox solutions but that may not offer all the features and integration of an enterprise solution. Even though it is not an enterprise edition, it’s more effective.
- Any Run
- Browserling
- Hybrid analysis
- Zeltser
- Joesandbox
- Cuckoo Sandbox
- Anubis
- Comodo Instant Malware Analysis
- Malwr
Here we are going to see more about the online free sandbox Analysis tool ANY.RUN.
What is ANY.RUN?
ANY.RUN is a malware analysis sandbox that you may interact with. The platform is open to all cybersecurity experts that want to learn more about the new malware types. Cybersecurity risks are detected, analyzed, and monitored by this service. A user-friendly interface makes it possible to conduct efficient and qualitative research.
All processes are displayed in real-time and, before the final version of the report is published, so that an analyst can spot all malicious operations.
Overview of the user interface and service provided by Any.Run:
Any.Run web console:
Here you can find the web console of Any.Run, where you can log in with the personal/professional email id after registering to Any.Run by clicking on the bottom left corner “SIGN IN” button.
Dashboard:
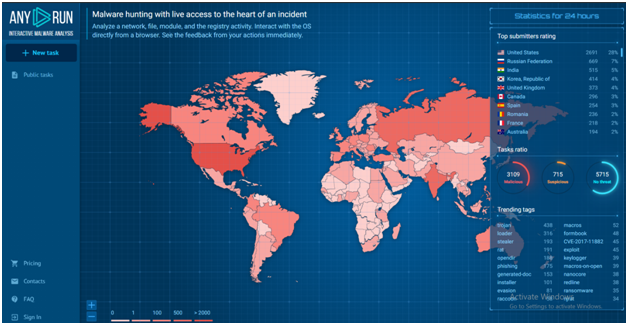
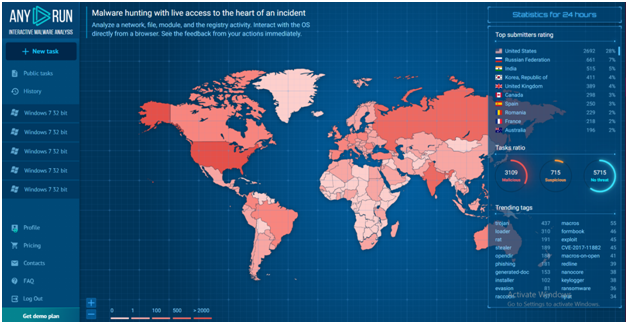
The below-attached screenshot is the ANY.RUN’s dashboard. Let’s explore it with little more details:
- There is a fixed map of uploaded malicious programs in real-time on the main page.
- On the right you can find statistics for the last 24 hours: you see an interesting sample, the number of tasks that are run right now, the total amount of submissions, and the task ratio.
- The top 10 countries with the most malware samples are in the right top corner.
- Information monitoring is always in real-time and up-to-date.
- Below to that task ratio is displayed based upon the three Verdicts.
- And the most trending tags are displayed with the count on the right bottom corner.
- There is a functional menu on the left to demonstrate the latest launched tasks and public submissions.
- To submit a sample on the analysis, press the “New task” button on the upper part of this section.
- Account settings, information about plans, FAQ, and support is also here. If you are a part of a research group, you’ll have a team history with your colleagues’ tasks.
Profile:
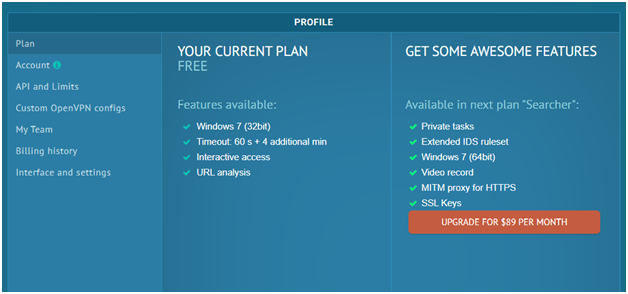
The profile window will take you to a page where you can see all of the details about your participation in the service:
- An option to upgrade your plan and look through the current one’s features;
- All profile information;
- Overview of your API and limits;
- Changing the OpenVPN configurations;
- Teamwork management;
- Information about your payments;
- Altering the default settings and interface.
Public submissions:
Both private and public tasks are possible. You can browse all of the jobs that service users have publicly uploaded here. ANY.RUN now has a massive database of over 2 million samples. The “Public tasks” window is the place where users share their investigations. It helps to investigate samples and collect IOCs. A detailed report will help you find the necessary information quickly and export it.
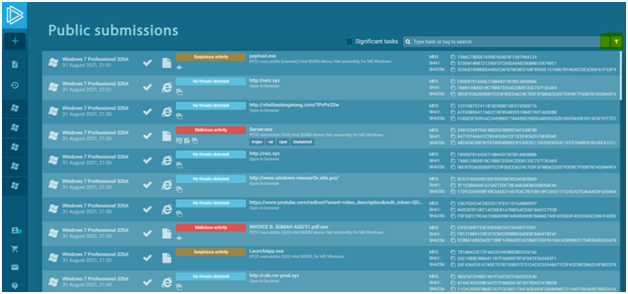
In the public submissions, there is a convenient filter system that includes a hash, a run type of examined object (URL or file), a verdict, extensions, and defined tags. You can fill in information about the hash type, domain type, IP address type, Mitre attack type, and Suricata SID type in the unique context section. Components can be configured using one or more parameters. You’ll be able to use the service for OSINT (open-source intelligence). If you have a potentially infected IOC, you need to filter it and find tasks with similar examples.
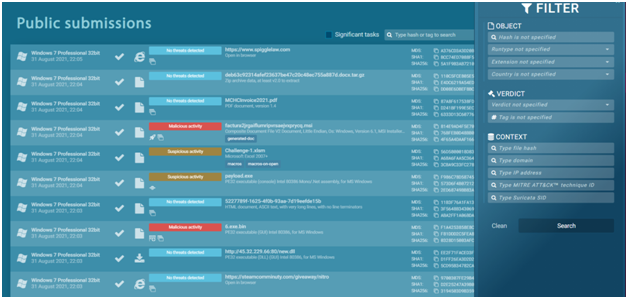
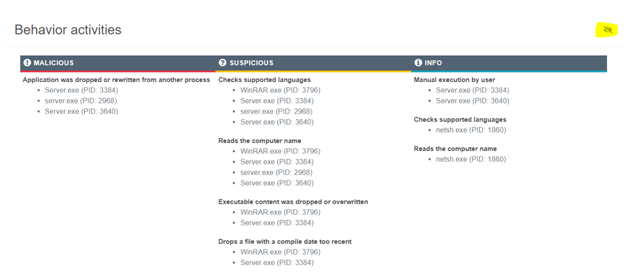
After analysis, each task gets a “Verdict” of the sample’s threat level. You can also filter tasks using the status.
There are three types of Verdicts:
- “Malicious”: malicious activity is detected;
- “Suspicious”: suspicious activity was detected and there is a possibility of the file to be malicious but it isn’t proved;
- “No threats detected”: ANY.RUN has detected no malicious or suspicious activity.
Also Read : Malware Analysis Use Cases with ANY.RUN Sandbox
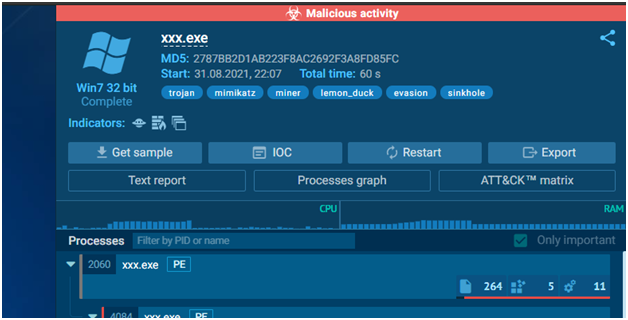
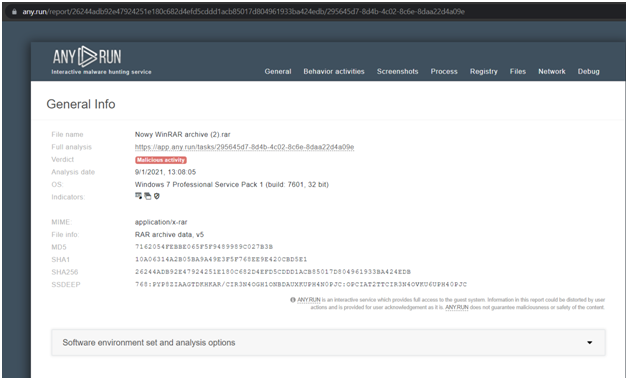
A sample public task opens in a new tab when you click on it. We can examine the analysis results right away, as well as visual analyses in the form of a video or a slideshow of screenshots.
The analysis reports are user-friendly; the most relevant data will be at the top. The final verdict, a summary of compromise indicators, the process behavior graph, the possibility to download the sample file, text report, Mitre ATT&CK Matrix, and other information are all included in the report.
New Task:
A new task is processed here with our own configuration settings. The palm will change according to the pricing. You can also rerun a job and observe it in real-time. You gain more features with the Searcher or Hunter plans, such as the ability to adjust essential configurations and evaluate how malware behaves on virtual PCs running various operating systems. At the same time, there’s no reason to compromise your computer by downloading a dubious file.
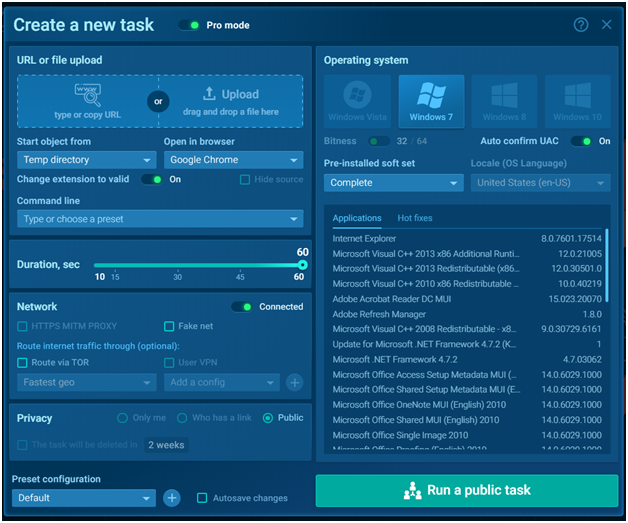
- Need to enable the pro mode to check more configurations.
- Need to set the parameters while running a new task orelse it will be in default settings.
- We can choose the version of the operating system from Windows Vista to Windows 10, interface language, 32bit or 64bit, and pre-installed soft set:
- Clean: Windows only
- Office: a standard office PC with typical office programs
- Complete: typical user environment with MS Office and additional programs such as FileZilla
- Further we can able to change the Duration, Network setting, privacy in searcher/hunter plan and can run a file via command line.
Also Read: How to Detect Privilege Escalation Attacks and UAC Bypass on Windows
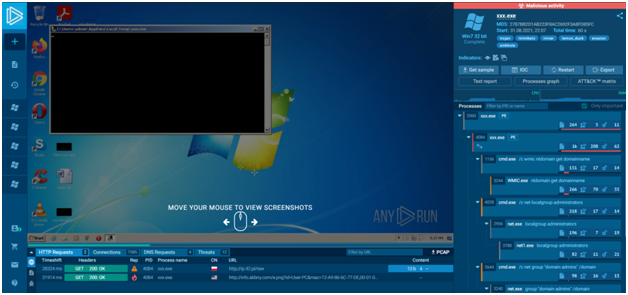
Task window:
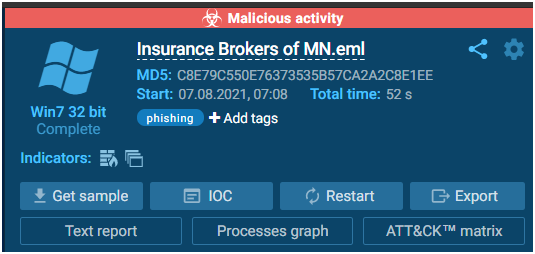
The task window displays all available information about the current task (either working or finished). As already mentioned before here we can analyze it interactively.
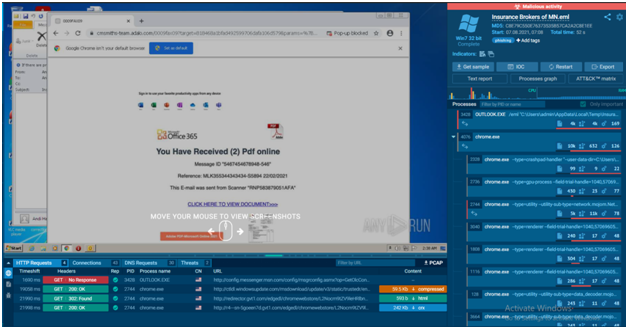
The information block which is placed on the right side will provide information about the task: the name of the submitted file of the URL address, date and time, tags, indicators, the tracker, OS version, and its environment. From the Info block, users also download the submitted sample, IOCs, restart the task, and can get access to “Process graph”, “Text report” and “ATT&CK Matrix”. There you can also export “JSON Summary”, “JSON IOC”, “HTML Document”, “Export Process Graph (SVG)” and “JSON MISP format”.
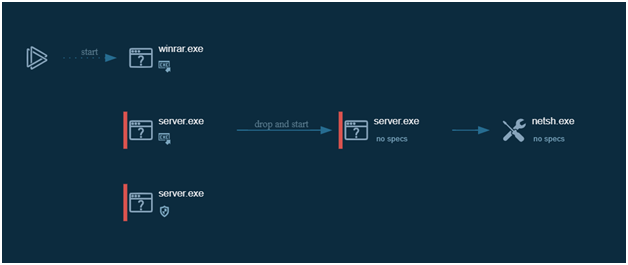
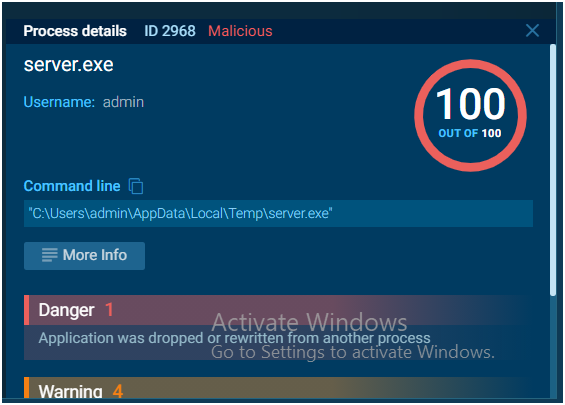
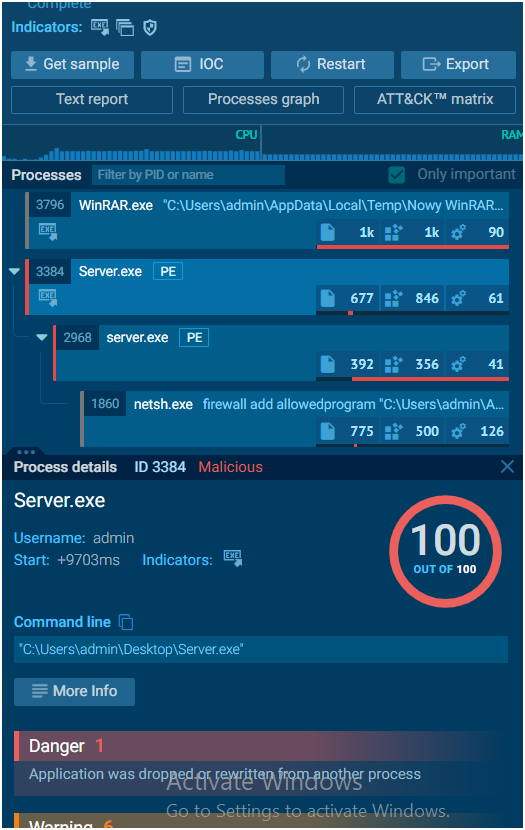
By selecting the “Process graph” button, you can see a graph that displays all of the processes in a convenient manner. Under each process, indicators are displayed that provide information about the process’s activities. If you want to learn more about a certain process, simply click on it to bring up the “Process information” window, where you can then click on more info to see a more detailed picture.
The “Text report” functionality exports information about all tasks actions as an HTML file. Note that by clicking on the “eye” icon in the upper-right corner of this block, you can exclude it from the report.
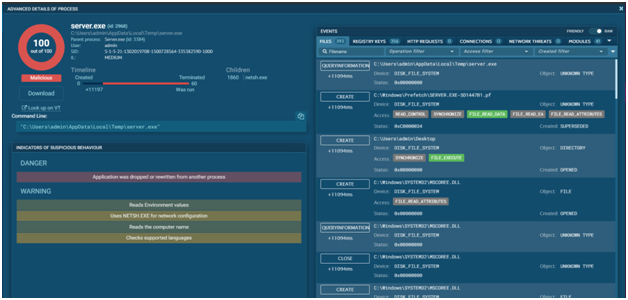
The process tree is shown on the right side of the analysis interface. On the same page, you’ll find a logical process structure as well as all relevant process details. Apart from that, clicking on the process brings up the ‘Process information’ window.
Visual Analysis:
In the middle, there is a visual analysis in the form of a video or a screenshot presentation. Below is a complete breakdown of the process. Three blocks provide comprehensive information:
Here the first left option denotes Network and the second one denotes files and the third one denotes debug.
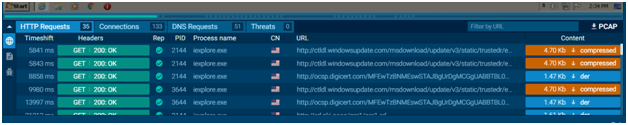
Network Block:
The “Network” block tells information about the exchange of malware packages in “HTTP Requests”, “Connections”, “DNS Requests”, and “Threats”. Copy what you need in the “Request Details” window.
- The “HTTP Requests” section displays details of the connection requests. You can see the response of the URL connection with the content. Filter by URL is available.
- The “Connections” section demonstrates other protocols that were not mentioned in “HTTP Requests”. You also get information if there is no response at all. The content of the packages and network stream is useful, click on “Traffic” to learn about it. Download extended data in PCAP and open in any other services. Filter by IP is available.
- The “DNS Requests” section is needed to show the correlation between a domain name and IP address. The status reflects whether it was successful or not: Responded or Requested. Filter by IP or domain is available.
- The “Threats” section detects intrusion in the systems owing to the Suricata rules. Malware is stated and the task is tagged. All information about suspicious activities will be here. Filter by a message is available.
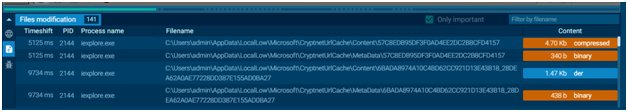
Files Modification block:
The “Files modification” block notes every file that was created by all processes. You can copy filenames and download “Static Discovering” information by clicking on “Content”.
Also Read: Soc Interview Questions and Answers – CYBER SECURITY ANALYST
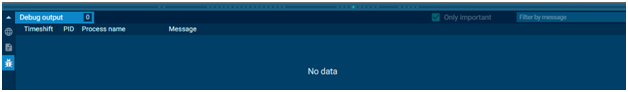
Debug Block:
The “Debug output” block gives extra information on how to debug the program afterward. If malware such as Dridex has debug output messages, they are going to be cited in this block.
Team management
A business could buy multiple licenses and distribute them to its employees. If a person becomes unavailable, their license might be revoked and redistributed to another person’s account. A fantastic technique to manage teams that are always changing. Each user’s plan determines the functionality, which is correlated with their own plan.
You may work as an entire team on one sample in real-time, have a common history of activities, and keep track of what tasks your employees launch using Team management. It’s also ideal for onboarding new employees. In addition, the leader has control over his team’s subscriptions.
Malware Tracker
ANY.RUN is more than just malware analysis software. It provides one more service Malware Trends Tracker, which displays statistics on uploaded malware by kind over a specified time period: all time, a month, two weeks, or the previous seven days.
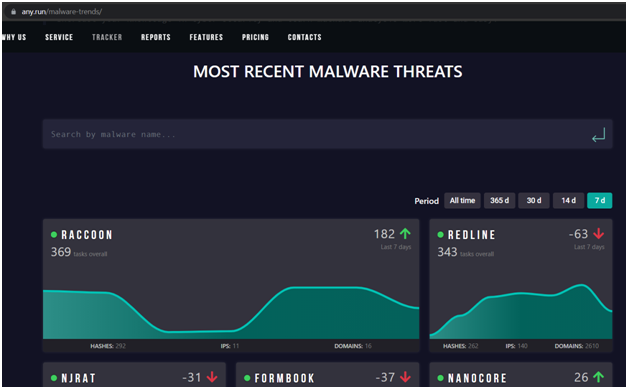
To learn more about a malware family, click on the cell containing the name of the malware:
- Malware description;
- Malware history;
- Video with typical execution;
- IOCs list with the last 20 IP addresses ;
- Hashes;
- Domain names.
Conclusion:
Threat actors seeking to break in play a game with security personnel and solutions ensuring they stay out. Sandboxes offer the necessary tools and isolation to give suspicious programs the attention they deserve before deploying on the production environment. Security analysts have better visibility into how software can operate and rest easy knowing how it will affect the network and other applications by evaluating potential malware in a pseudo-production environment.
ANY.RUN is a user-friendly and interactive service. You can also keep an eye on malware in real-time, tweak the system’s settings, and get a full report at the end of the investigation. Even inexperienced malware researchers will be able to understand the report because it is prepared in an easy-to-understand manner. ANY.RUN is beneficial to both novice and advanced analysts because it speeds up and increases the efficiency of their work.