


")


Command and control (C2) infrastructure forms the backbone of modern malware operations. SOCs need to find and stop this infrastructure before it can be used to widen an incident. A practical way to do that is to watch what malware samples are connecting to right now — the newest domains, IPs and file hashes that show up in live malware analyses.
Seeing What Malware Sees
ANY.RUN’s Threat Intelligence Lookup exposes exactly that kind of data: for each malware family it lists the most recent sandbox sessions, newly observed domains, IP addresses and hashes, and links to analyzed sessions so analysts can see behavior and network context instantly.
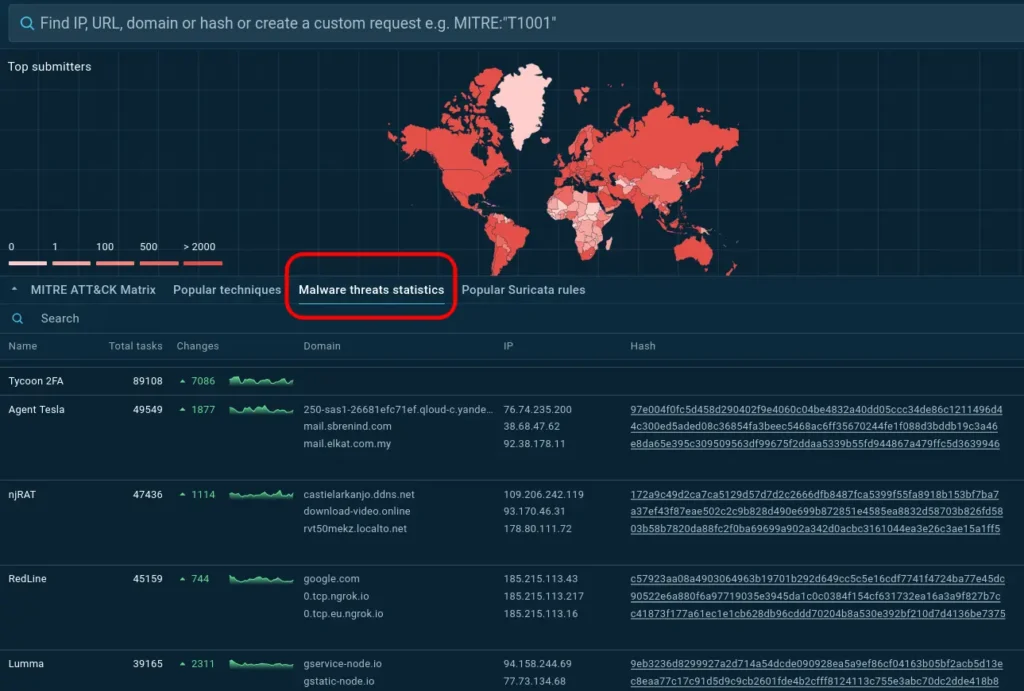
Click “Malware Threats Statistics” on Threat Intelligence Lookup main page to view real-time IOCs of top malware
Threat Intelligence Lookup is an interactive malware intelligence solution that aggregates data from over 15,000 Security Operations Centers worldwide that use the Sandbox for incident investigation and threat analysis.
It indexes millions of malware samples and their associated indicators, making this collective intelligence searchable through over 40 parameters including file hashes, domains, IPs, malware families, MITRE ATT&CK techniques, process behaviors, and geographic data.
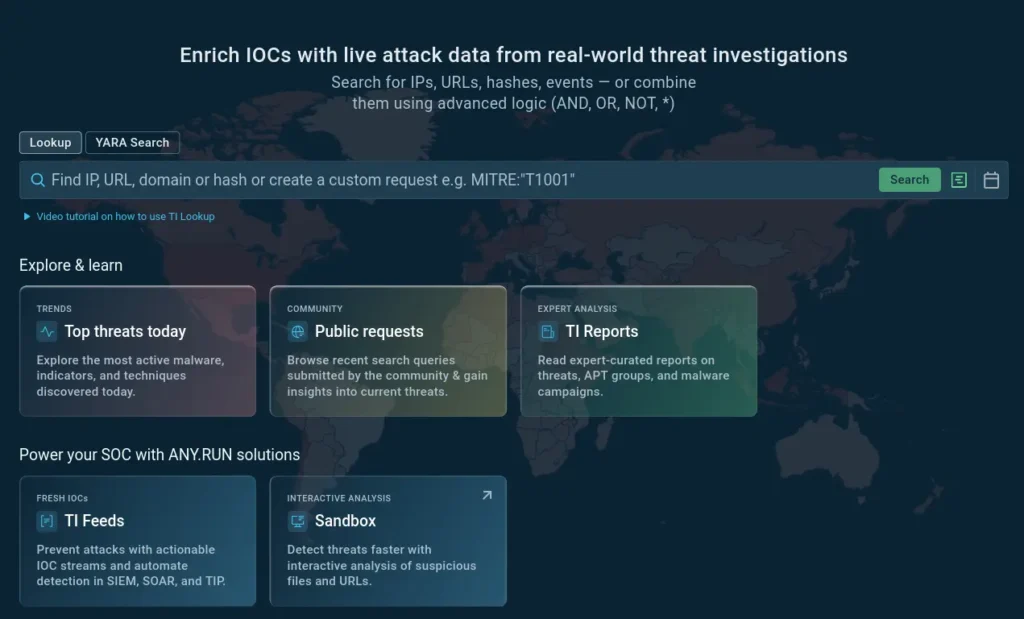
TI Lookup: use Search Query Bilder to compose search parameters into insightful lookups
The Malware Threats Statistics feature of TI Lookup addresses analysts’ need for up-to-the-minute data on the indicators related to the most active and dangerous malware families.
Revealing what’s active right now
Malware Threats Statistics provides analysts with several immediate benefits for their daily operations:
- Proactive blocking: When a new Lumma Stealer or AsyncRAT campaign begins, the associated C2 domains appear in the statistics within hours of detection. Security teams can feed these indicators directly into their firewall rules, proxy blocklists, and SIEM correlation rules before the malware reaches their networks.
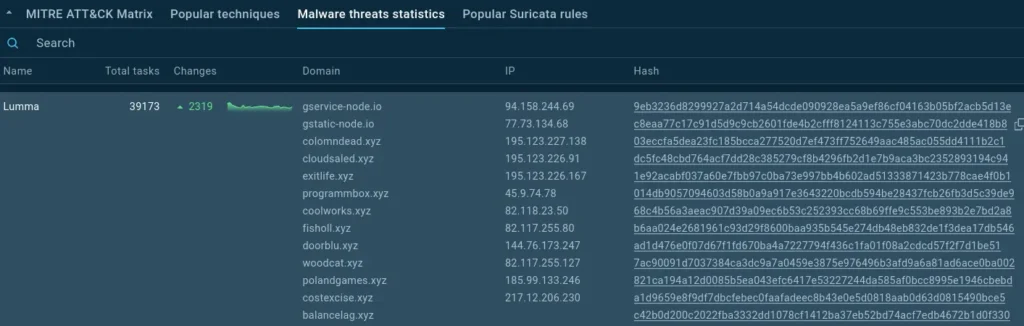
Domains and IPs recently linked to Lumma stealer
- Incident response acceleration: During an active investigation, analysts can quickly determine whether suspicious domains or IPs in their logs match known malware infrastructure. The session count next to each malware family provides context about how widespread the threat is: a domain linked to hundreds of Agent Tesla sessions demands more urgent attention than one appearing in just a handful.
Try instant actionable intelligence: sign up to TI Lookup and check indicators in seconds.
- Infrastructure pattern recognition: By examining the domains and IPs associated with specific malware families over time, analysts begin to recognize operational patterns. Some threat actors register domains in predictable batches, use specific hosting providers, or follow naming conventions that become signatures in themselves.
- Correlation across campaigns: The statistics reveal when different malware families share infrastructure, suggesting possible connections between threat actors or malware-as-a-service relationships. A domain appearing in both AsyncRAT and RedLine Stealer sessions might indicate shared distribution networks or common operators.
Beyond the Obvious: Hidden Intelligence Value
There are also a number of more sophisticated variants to make use of this data for threat hunting, deeper analysis, and strategic intelligence.
1. Infrastructure churn and lifetime
By tracking when a domain first appears and how long it continues to be associated with samples, analysts can compute average C2 lifetime for a malware family. That helps choose containment windows and informs decisions about whether automated blocking rules (short TTL) or longer manual takedown actions are better.
2. Malware ecosystem mapping
The relationship between malware families and their infrastructure reveals the broader threat landscape. When new malware variants suddenly appear with infrastructure patterns similar to established families, it suggests code sharing, rebranding, or evolution within existing operations rather than entirely new threats.
3. Attribution pivot points
IP addresses that host C2 servers for multiple malware families over time become valuable pivot points for threat hunting. These shared hosting patterns can connect seemingly unrelated campaigns and reveal common infrastructure providers favored by specific threat actor groups.
4. Timing analysis
The freshness of the data allows analysts to observe when threat actors shift infrastructure. Domains that appear in statistics during specific time windows (business hours in certain time zones, for example) can provide clues about operator locations and work patterns.
5. Quality assurance for internal feeds and detection rules
Use the live statistics to test and tune SIEM/sensor rules: feed a sample of “new” C2s into detection pipelines and measure how many true positives vs false positives the rules produce, adjusting signatures or enrichment thresholds accordingly.
Why real-time IOCs matter
- C2 infrastructure moves fast. Domains and IPs used by actors are created, rotated and retired quickly. An IOC that was valid yesterday may be irrelevant today. Freshness reduces “dwell time” (time malware remains unnoticed) and improves the signal/value of alerts.
- Faster containment, less collateral. A validated, recent IOC allows SOCs to quarantine affected endpoints and block the exact endpoints rather than broad blocks that disrupt business. Quick action reduces lateral movement and data exfiltration risk.
Threat Intelligence Lookup serves as an immediate verification layer for potential IOCs. When an analyst encounters a suspicious domain in logs or during investigation, they can check it against the latest malware statistics and sandbox sessions. This instant verdict eliminates the uncertainty of working with indicators of unknown provenance or age:
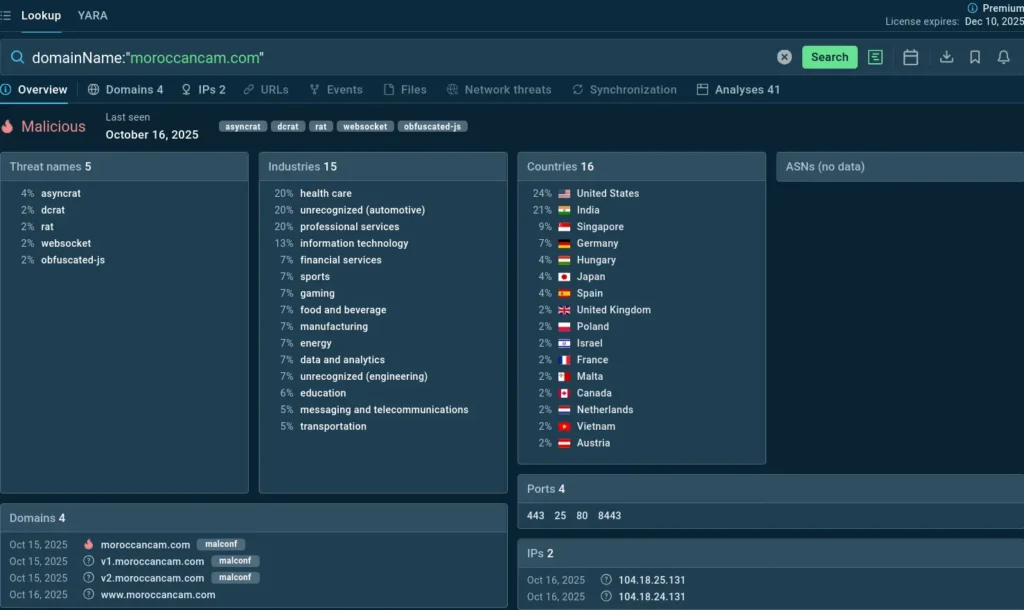
Threat Intelligence Lookup: IOC verdict and context
The analyst instantly learns:
- if the indicator is malicious,
- if it was spotted in latest attacks,
- what malware family it belongs to,
- what the malware does,
- how it does that (switch to the Analyses tab to see sandbox malware detonations),
- what additional IOCs can be used to detect the malware.
This efficiency compounds across hundreds of daily alerts, freeing up time for higher-level threat hunting and client communication — tasks that truly require human expertise.
TI Lookup Research Potential: Understanding Regional Threat Distribution
Threat Intelligence Lookup extends its value into research by supporting advanced queries combining different search parameters, wildcards, and settings like a time period. For example, analysts can combine threat names with country codes to filter sandbox sessions by the geographic location of users who submitted samples for analysis.
threatName:”AsyncRAT” and submissionCountry:”DE”
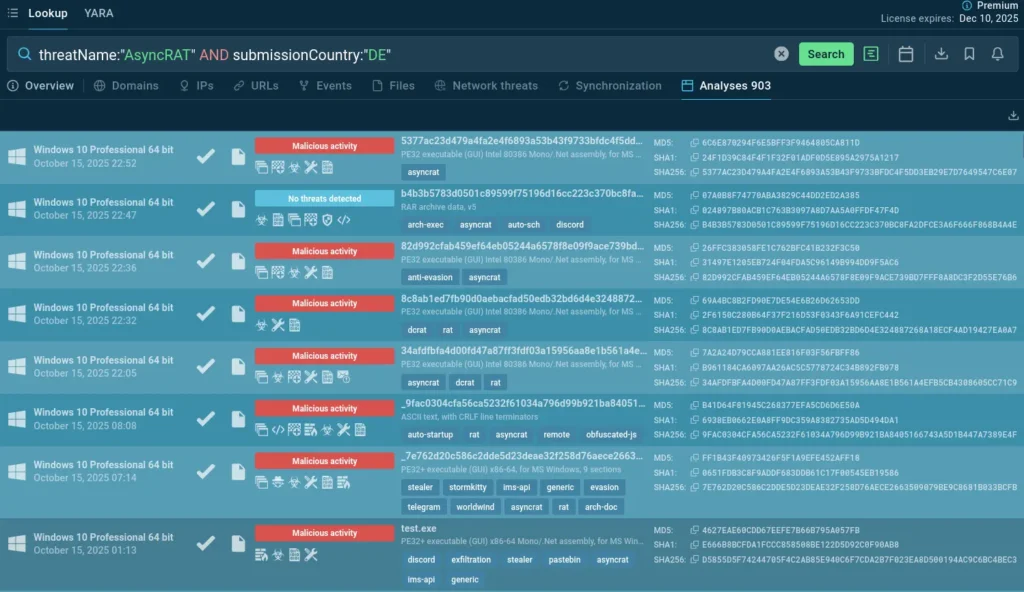
Threat name plus country code: search for regional trends
This geographic lens opens new analytical perspectives.
- Regional targeting identification: The search reveals whether malware campaigns target specific countries or operate globally. A malware family with significantly more sessions from one country suggests targeted operations, localized distribution methods, or region-specific vulnerabilities being exploited.
- Campaign timing and rollout: By comparing session timestamps across different countries, analysts can observe how campaigns spread geographically. Do attacks hit multiple regions simultaneously, or does the threat actor test in one market before expanding? This intelligence helps predict where threats might appear next.
- Infrastructure preferences by region: Different countries have different hosting ecosystems and internet infrastructure. Examining which C2 servers are associated with sessions from specific countries reveals whether threat actors use local hosting to reduce latency and avoid cross-border traffic scrutiny, or centralize their infrastructure regardless of victim location.
- Language and localization indicators: When malware sessions cluster strongly in particular countries, it often correlates with language-specific lures, localized malware payloads, or regional distribution channels. This helps security teams understand not just where threats appear, but why they concentrate in certain areas.
IOC Validation and Prioritization: A Very Quick Guide
- ️Newly seen IOC (<48h) → escalate as active infrastructure.
- Repeated IOC (appears in many samples) → tag as widely used — potential large-scale campaign.
- IOC inactive for >14 days → likely stale; lower response priority unless confirmed in your telemetry.
Goal: Focus response on live C2s and avoid wasting time on dead ones.
| Take your alert triage, detection and response to the next level Contact ANY.RUN to get 50 trial lookups. |
Conclusion: Building a Proactive Threat Intelligence Practice
The value of Malware Threats Statistics extends beyond separate lookups. For mature SOC operations, this data can be a foundation for continuous threat monitoring. Analysts establish baseline patterns for malware families relevant to their industry and geography, then watch for deviations that signal new campaigns or tactical shifts.
By integrating real-time C2 tracking into daily operations, security teams move from reactive defense to anticipatory posture. They’re not waiting for their own systems to encounter threats. They’re watching malware infrastructure emerge across the broader threat landscape and preparing defenses before attacks arrive.
This shift from historical threat intelligence to real-time observation fundamentally changes how SOCs operate. With current data on malicious infrastructure at their fingertips, analysts can focus less on validating whether indicators are still relevant and more on understanding attacker behavior, predicting next moves, and hardening defenses against emerging threats.